Watergy
By Brad Lancaster
© 2010 www.HarvestingRainwater.com
Watergy is a term coined to describe the interconnection of water and energy. Every time we consume power we consume water. This is because water is used in the generation of our power – in Arizona this figure ranges from 0.001 to 56 gallons of water per kWh of power consumed.1 Therefore, anything we can do to reduce our power consumption also reduces our water consumption.
Typically the amount of water consumed during power generation is much greater when the power is generated at centralized power plants, as opposed to on-site with renewable power production such as rooftop solar, whose water consumption is negligible.
Introducing a Watergy Cost Calculator for You and Your Community
How much water is expended in the generation of electricity from different sources?
How much energy, and subsequently embedded water, do average U.S. and Arizona households use per month, depending on where their energy comes from?
How about you and your community?
Use our interactive online Community Watergy Calculator to find out.

The Community Watergy Calculator was conceived of by me, and created by Megan Hartman, based mainly on watergy data for Arizona from this wonderful and succinct resource “The Water Costs of Electricity in Arizona.”
Still more watergy information can be found here.
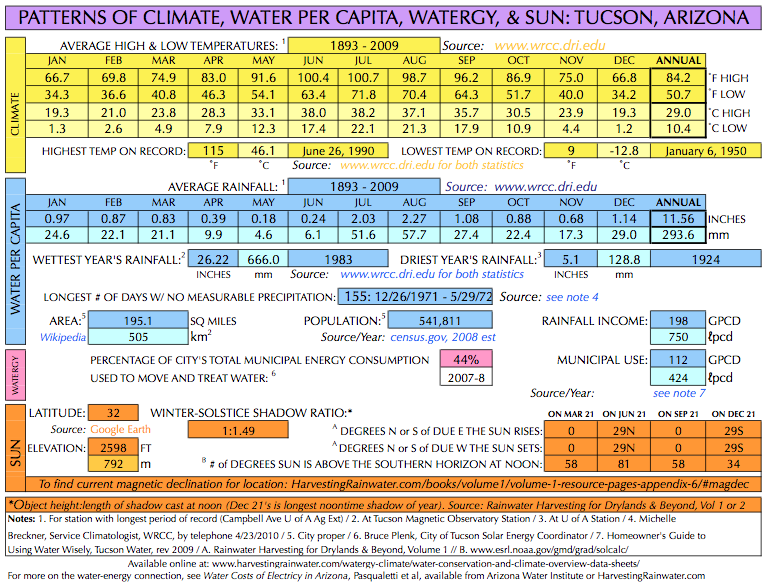
Before I speak or teach in various communities, Megan generates one-page Water Conservation and Climate Data sheets (newer versions contain additional information for site analysis and are called Patterns of Climate, Water Per Capita, Watergy, and Sun) for those communities. Many of these are available here, with more being added on a regular basis. These spreadsheets also list:
• What percentage of the community’s energy consumption is used to move (or move and treat water), or the number of average energy-consuming homes that could be powered with the energy used to pump/treat water, depending on the data we are able to obtain.
• How much rain per person per day falls on the community in a typical year (rainfall GPCD) compared to how many gallons of municipal water per person per day are consumed in a typical year (municipal GPCD). In most cases, per year, a greater volume of rain falls on the community than is provided by the municipality. This helps make the case that if the community were to harvest and utilize more of that free, high-quality rainwater, it could reduce or eliminate its depletion of local water sources, and reduce or eliminate the “need” for the high cost/high energy importation of water from elsewhere.

For updated Patterns of Climate, Water per Capita, Watergy, and Sun for many locations around the world see here
For simple and effective tips on how you can greatly reduce your energy consumption at home; increase your on-site passive heating, cooling, and solar power production; and enhance comfort and productivity, see Chapter 4 of Rainwater Harvesting for Drylands and Beyond, Volume 1. The whole book is packed with great info on how you can make progress on goals like these, while greatly enhancing the potential and use of your local rainfall, stormwater, greywater, and more.
For updated water-energy-carbon nexus tables see here
[BREAK]
1. Extrapolated from Water Costs of Electricity in Arizona, a Project Fact Sheet of the Arizona Water Institute (Tucson, Arizona) from a 2007 investigation by Pasqualetti & Kelley. Fact Sheet ID: AWI-07-102 Pasqualetti.
See the new, full-color, revised editions of Brad’s award-winning books
– available a deep discount, direct from Brad:

Volume 1
Volume 1 has a whole appendix on the water-energy-carbon nexus

